Portfolio AI Ops
Deploy and measure AI across portfolio companies with a Brier-scored forecast ledger. Proof, not pilots.
Book a 15-min intro All 9 systems
For PE operating partners

Your portfolio spent $2M on AI last year.
Nobody scored the claims.

Portfolio AI Ops deploys AI inside your portfolio companies and files every claim as a dated, probabilistic forecast. When the date arrives it resolves YES or NO and gets scored. You walk into the IC with a calibrated track record instead of a slide of vendor logos.

Risk reversal: if the diagnostic does not find at least $500K of measurable annualised upside across the portfolio, you do not pay for it.

7.3x
measured return on resolved deployment spend
0.206
portfolio Brier score, independently checkable
59%
forecast accuracy improvement across three cohorts
36
forecasts on the ledger, 30 already resolved
The problem

Every AI number you have been shown is unfalsifiable.

An operating partner asks a portfolio CEO how the AI rollout is going. The answer is "great, the team loves it." That is not a number. The vendor sends a dashboard showing 14,000 documents processed. That is not a number either, it is an activity count.

Then the IC asks the only question that matters: what did the AI spend actually return? And there is nothing to say. Not because the spend was wasted, but because nobody wrote down what was supposed to happen before it happened.

Without a claim recorded in advance, every outcome is a success in retrospect. The wins get attributed to the AI. The losses get attributed to the market. Nothing is learned and the next allocation is made on exactly as little information as the last one.

"We have eleven AI initiatives across nine companies. I could not tell you which three are working." — Operating Partner, $900M lower-middle-market fund

What you are currently being sold

And why none of it survives an LP question.

  • MBB digital diligence. $500K to $2M, six months, ends in a deck. No deployment, no measurement, nobody is on the hook for the forecast.
  • Per-seat AI SaaS. Reports seats and usage. Attribution to EBITDA is left as an exercise for you.
  • An internal hire. Nine months to find, $280K loaded, and the first year is spent learning your portfolio rather than changing it.
  • Innovation theatre. A pilot in one company, a case study, and a quiet death at renewal.
  • Doing nothing. Defensible for one more cycle. Not two.
How it works

Deploy it. Predict it. Score it. Repeat.

Four steps, run on a quarterly cadence across the companies you select. The discipline is that step two happens before step three, in writing, with a date.

01

Instrument

Two weeks inside the operating data of each selected company. We find where the margin actually leaks and size it with the CFO, not with a benchmark.

02

Underwrite

Every initiative is filed as a resolvable claim with a named metric, a threshold, a date, and an explicit probability. Signed off before a line of code ships.

03

Deploy

The system is built and put into production in the company. Not a pilot, not a sandbox. Deployment cost is booked against the forecast whether it lands or not.

04

Resolve

On the date, it settles YES or NO from the company's own systems. The ledger recomputes the Brier score, the calibration curve, and the portfolio ROI.

The ledger

The number that cannot be spun.

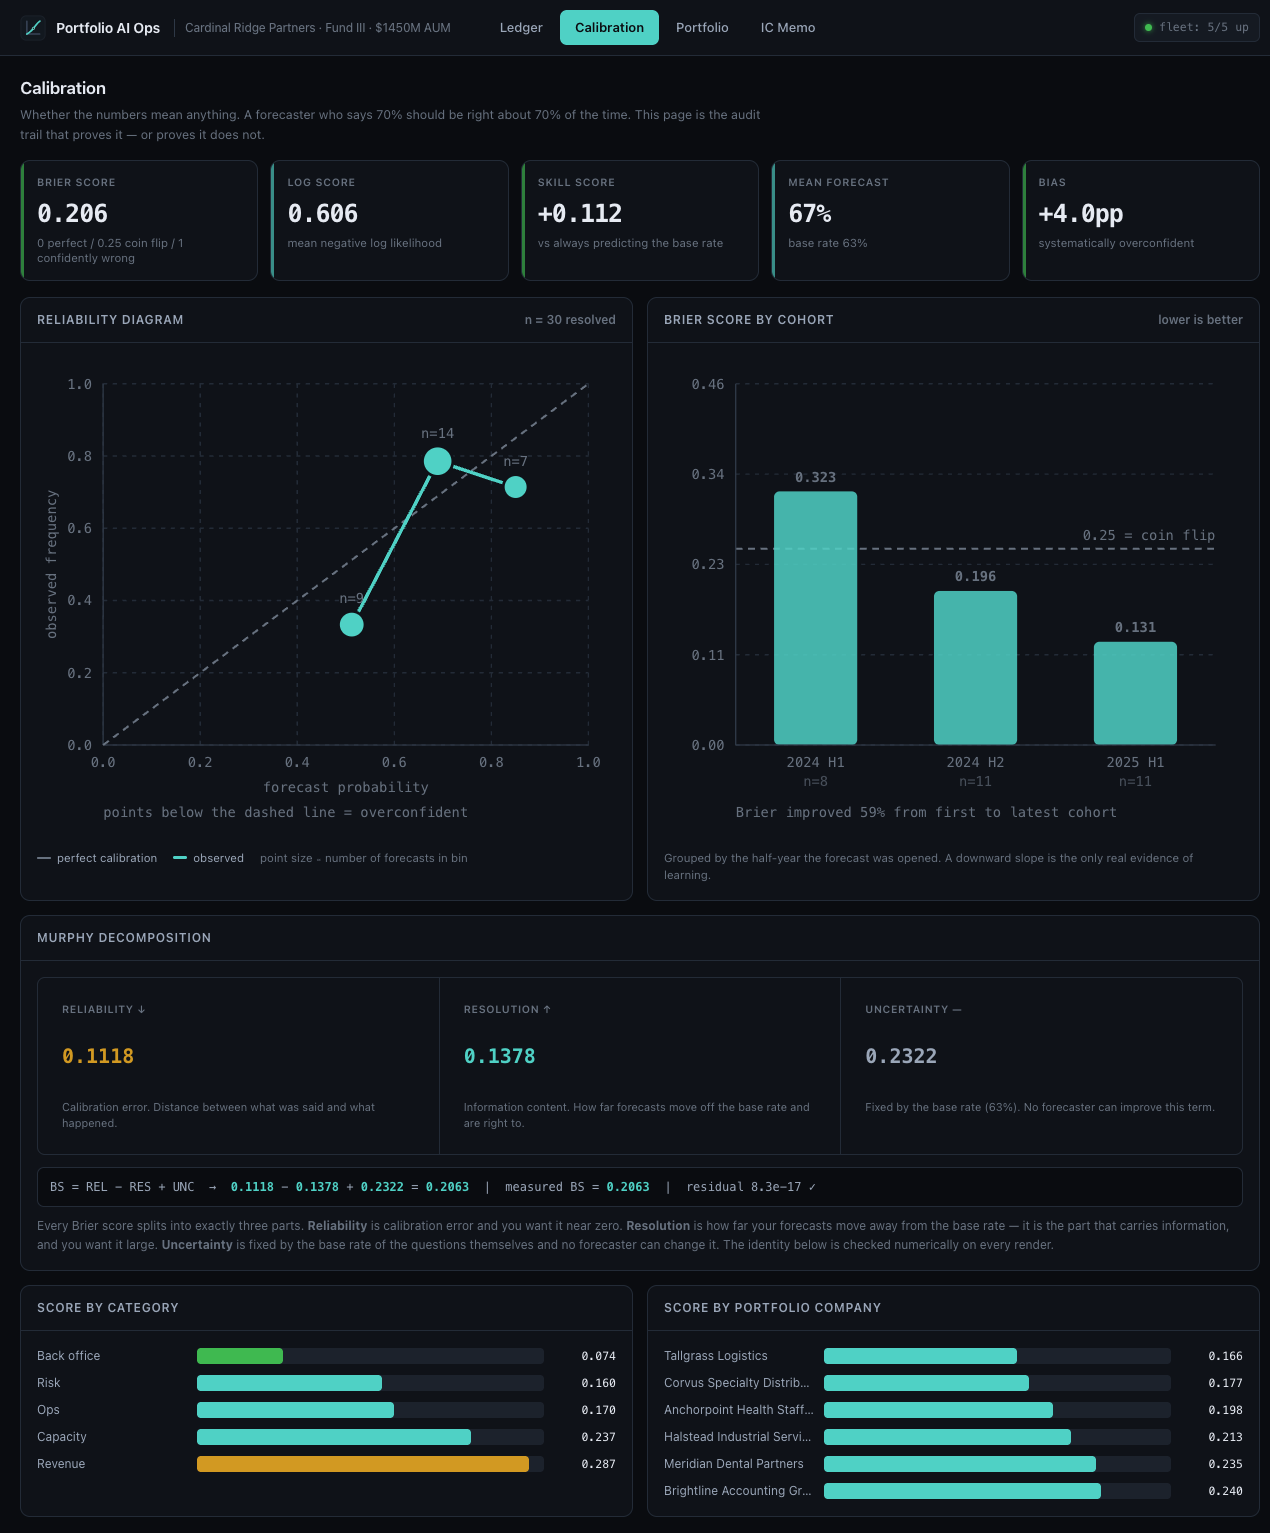
A Brier score is the mean squared error of your probabilities. Zero is perfect. 0.25 is what you score by shrugging and saying fifty-fifty. It is arithmetic on a public record, so it is the one AI metric in your portfolio that a sceptical LP cannot argue with.

portfolio-ai-ops — calibration
Calibration view showing reliability diagram, cohort Brier trend and Murphy decomposition
"AI is a major value creation lever for us." Brier 0.206 across 30 resolved forecasts.
"The rollout is going really well." 63% hit rate, 95% CI 46–78%, on the record.
"We processed 14,000 invoices." $12.71M realised against $1.75M deployed.
"We're learning a lot from the pilots." Cohort Brier: 0.323 → 0.196 → 0.131.
IC-ready

An answer to the only question

Every quarter you get a memo where each figure is computed from the ledger rather than asserted. Including the forecasts you got wrong, listed first.

59%

Underwriting that improves

Scoring forecasts is what makes the next forecast better. Across three cohorts the demo ledger shows Brier falling from 0.323 to 0.131 on the same discipline.

4 wks

Production, not pilots

First system live in a portfolio company inside four weeks of kickoff. Deployment cost is booked against the forecast whether or not it lands.

Pricing

Priced against one wasted pilot.

A single unmeasured AI pilot runs $150K–$250K and teaches you nothing you can take to the IC. That is the real comparison, and it is the reason the diagnostic is priced below it.

Diagnostic
$18K
one-time · 3 weeks · no retainer

Find out whether there is anything here worth deploying, and score the claims already made.

  • Up to 3 portfolio companies instrumented
  • Retroactive scoring of the last 4 quarters of AI claims
  • Baseline calibration report and deployment map
  • Sized, underwritten forecast slate for the next cohort
Start here
Most funds start here
Deployment
$45K + $12K/mo
setup · 6-month minimum term

Systems in production in up to four companies, with the forecast ledger run as a standing quarterly cadence.

  • Up to 4 portfolio companies, systems live in production
  • Full forecast ledger, hosted and LP-shareable
  • Quarterly resolution cycle and IC memo
  • Direct line to the engineer who built it, not an account manager
  • +$2,500/mo per additional portfolio company
Book the diagnostic
Portfolio Standard
$60K + $22K/mo
setup · 12-month term

The forecast ledger becomes the fund's operating standard for every AI claim, in every company, including new platforms at close.

  • Up to 10 portfolio companies
  • New platform companies instrumented within 30 days of close
  • LP-ready quarterly reporting pack
  • Diligence support on AI claims in live deals
  • Operating-partner training on forecast underwriting
Talk it through

The arithmetic on Deployment, first year

Four companies. Conservative: assumes the programme lands at the low end and one deployment in three fails outright.

Setup$45,000
Retainer, 12 months at $12K$144,000
Total year one cost$189,000
Realised value at a conservative 3.0x (vs 7.3x on the demo ledger)$567,000
Net EBITDA effect, year one$378,000
At a 9x exit multiple, enterprise value created$3.40M
Payback period4.0 months
Objections

The questions you were going to ask anyway.

What happens if the forecasts score badly?

Then you find out early and cheaply, which is the entire point. A bad Brier score in quarter one is worth more than a good anecdote in quarter four, because it tells you the underwriting is wrong while the cheque is still small. The demo ledger opens at 0.323, which is worse than a coin flip. It is shown rather than hidden because a measurement system that only ever reports good news is not a measurement system.

We already have a data and analytics team. Why do we need this?

Your analytics team reports what happened. This is a discipline for committing to what will happen, in advance, with a probability attached, and then being scored on it. Those are different jobs and most analytics teams are not asked to do the second one. In practice this runs alongside them: they usually own the data access, we own the underwriting and the deployment. If your team already files dated probabilistic forecasts and computes calibration on them, you genuinely do not need me.

We tried AI consultants and got a deck. Why is this different?

Two structural differences. First, deployment cost is booked against the forecast whether or not it lands, so I carry the consequence of my own optimism. Second, there is a number at the end that I cannot spin. A consultant's engagement ends with a recommendation; this one ends with a score that follows me into the next quarter. Ask any firm that pitched you for their Brier score across prior engagements. They will not have one.

Will the portfolio company CEOs actually cooperate?

They cooperate when the forecast is co-signed rather than imposed. The claim is sized with their CFO and the metric comes out of their systems, so it is their number and not a number the fund invented. The failure mode to avoid is using the ledger as a performance-management stick on the CEO. It is a measurement of the AI programme, not of the operator, and it has to be introduced that way or you will get gamed metrics within a quarter.

How do you handle data security and access?

Inference runs on owned GPU hardware on a private network, not on a third-party API, so portfolio company data does not leave infrastructure you can inspect. Access is granted per company, scoped to the systems a specific forecast depends on, and revoked at resolution. Standard fund NDA plus per-company MSA. If a company requires full on-prem deployment, that is supported and priced as an add-on.

$18K for three weeks. Why should the diagnostic cost anything?

Because a free diagnostic gets treated like a free diagnostic. The paid version gets the CFO in the room, gets the data access approved, and produces a slate you can actually act on. It is also the cheapest position in the market against the $500K MBB alternative, and it credits in full against the Deployment setup fee if you continue. If it does not surface at least $500K of measurable annualised upside, you do not pay for it.
Next step

Pick three portfolio companies.
Find out in three weeks.

The diagnostic is three weeks, $18K, and credits in full against Deployment. If it does not find $500K of measurable annualised upside, you do not pay.

Mike Rodgers · forward-deployed engineer · builds and deploys the systems personally